Uptime Monitoring: Availability Checks Every 30 Seconds
Monitor availability with second-level precision — detect outages before your users do.
How It Works
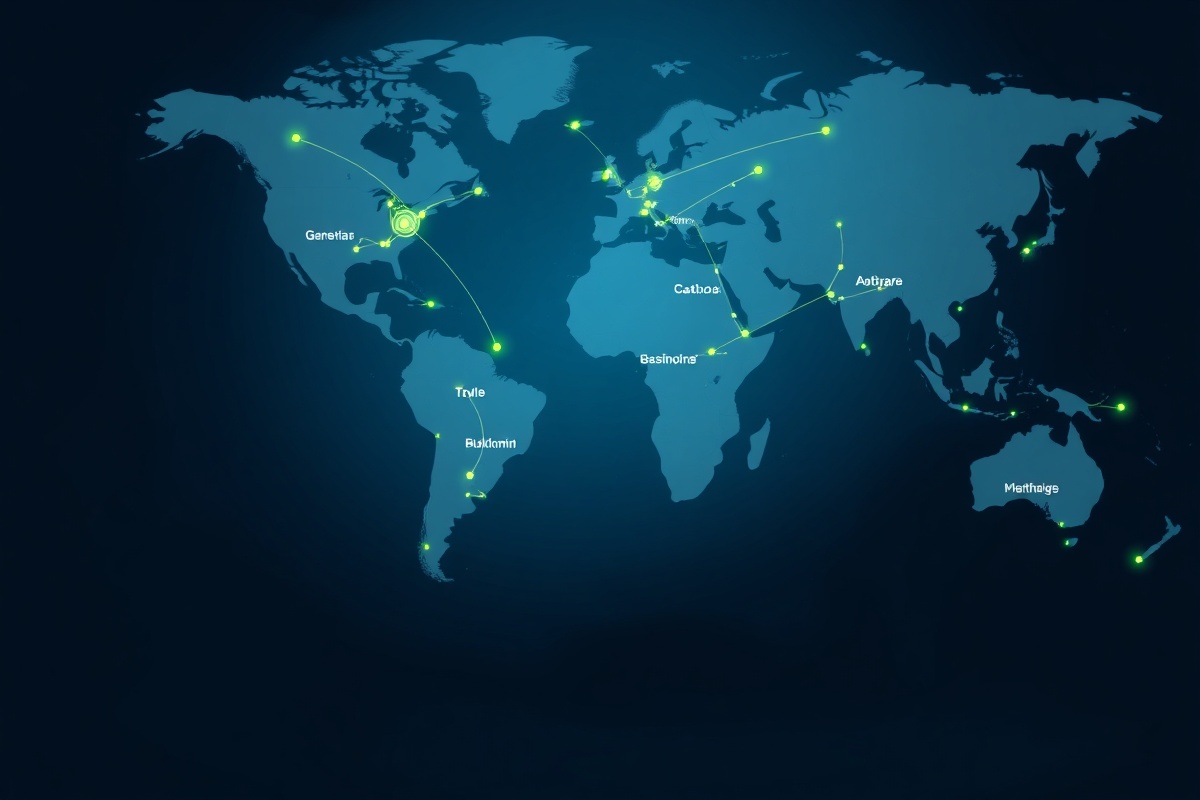
Pulsely probes your endpoints every 30 seconds from 18 monitoring nodes across North America, Europe, Asia-Pacific, and South America. Each probe measures response time, HTTP status code, TLS handshake duration, and content integrity — then aggregates the results into a single uptime percentage.
Supported Protocols
| Protocol | Check Interval | What It Validates |
|---|---|---|
| HTTP / HTTPS | 30 seconds | Status code, response time, body content match, redirect chain |
| TCP | 30 seconds | Port reachability, connection establishment time |
| ICMP (Ping) | 30 seconds | Packet loss, round-trip latency, TTL |
| DNS | 30 seconds | A/AAAA/CNAME/MX record resolution, answer consistency across regions |
| SSL/TLS Certificate | 30 seconds | Expiry date, issuer chain, protocol version, cipher suite strength |
30-Day Uptime Dashboard — Example
For api.acme-corp.io monitored from all 18 nodes, the last 30 days show 99.97% uptime — one 4-minute incident on Nov 12 caused by a certificate renewal timeout in the Frankfurt node. The dashboard breaks down uptime by region, plots response-time percentiles (p50, p95, p99), and flags any node that diverges more than 200 ms from the global median.
Why Pulsely Uptime Monitoring
Built for engineering teams that need actionable data, not just green checkmarks.
Speed
30-Second Probes, 60-Second Alerts
Every endpoint is checked every 30 seconds. When a failure is confirmed across two consecutive probes, Pulsely fires a notification via Slack, PagerDuty, email, or webhook — typically within 60 seconds of the first symptom.
Coverage
18 Global Nodes, 6 Continents
Nodes in New York, Ashburn, London, Frankfurt, Paris, Singapore, Tokyo, Sydney, São Paulo, Mumbai, Toronto, Stockholm, Seoul, Mumbai, Cape Town, Mexico City, Jakarta, and Dubai give you a true picture of global availability — not just what one data center sees.
Accuracy
99.99% Measurement Fidelity
Dual-probe confirmation eliminates false positives. TLS fingerprinting and content hashing ensure you're alerted only when something truly changes — not when a CDN rotates an edge node.
History
365 Days of Retained Metrics
Every response time, status code, and certificate expiry date is stored for a full year. Export to CSV or query via REST API to correlate uptime events with deployment schedules or incident tickets.
Integrations
Slack, PagerDuty, Opsgenie, Webhooks
Route alerts to the tool your team already uses. Set distinct escalation paths per monitor — critical API endpoints go to PagerDuty, while internal staging checks post to a dedicated Slack channel.
Transparency
Public Status Pages in Minutes
Generate a branded, embeddable status page that shows real-time uptime, incident timelines, and SLA compliance for your customers. No extra hosting or maintenance required.