Uptime Monitoring with Second-Level Precision
Pulsely tracks your websites, APIs, and microservices from 18 global nodes. Get alerted via Slack, PagerDuty, or email the moment something goes down — before your users notice.

Why Teams Switch to Pulsely
Every second of downtime costs revenue and trust. Pulsely gives you the visibility and speed to stay ahead of incidents.
Checks Every 30 Seconds
Unlike competitors that poll on 3- or 5-minute intervals, Pulsely runs HTTP, HTTPS, DNS, TCP, and SSL checks every 30 seconds by default. You'll detect a 2-second outage before it becomes a 2-minute one.
Multi-Channel Notifications
Route alerts to Slack, Microsoft Teams, PagerDuty, Discord, webhook endpoints, SMS, or email — with escalation policies that ensure the right person is notified at the right time.
18 Monitoring Nodes Worldwide
Nodes in New York, London, Frankfurt, Tokyo, Singapore, Sydney, São Paulo, Mumbai, and more. See exactly which regions experience latency spikes or failures.
Branded Status Pages in One Click
Publish a public status page for your customers with zero configuration. Custom domain, dark mode, and real-time incident timelines — all included.
REST API & Terraform Provider
Manage monitors, teams, and alert rules programmatically. The Terraform provider and full REST API let you treat monitoring infrastructure as code.
365 Days of Uptime History
Every check result is stored for a full year. Generate monthly uptime reports, audit compliance, and spot trends with built-in analytics charts.
See It in Action
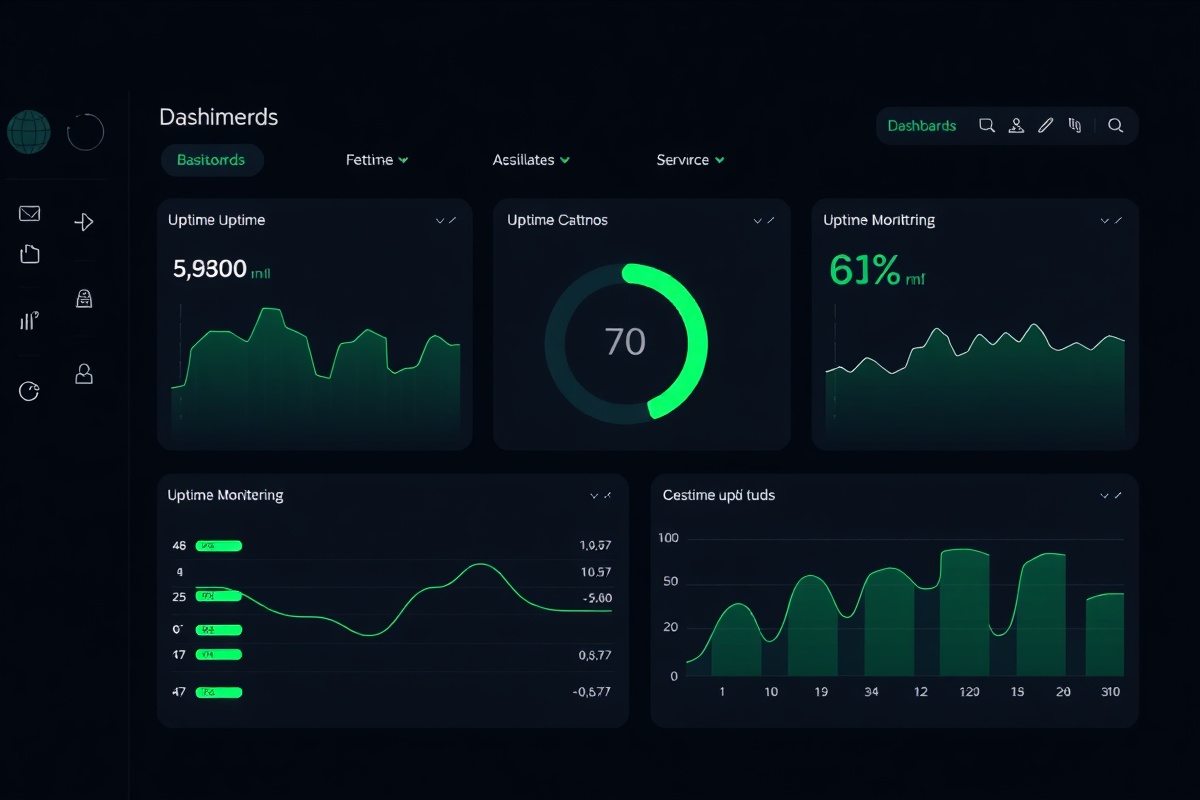
The Pulsely dashboard gives you a real-time view of every monitored endpoint — response times, SSL certificate expiry, DNS propagation, and error rates — all in one place.
Trusted by Engineering Teams Building at Scale
From startups to enterprises, Pulsely keeps critical services visible around the clock.
99.99%
Average uptime across all monitored endpoints in the last 30 days.
< 60 Seconds
Median time from incident occurrence to first alert delivered to your team.
142M+
Health checks performed daily across our global node network.
Integrations That Fit Your Stack
Pulsely connects with the tools your team already uses — no context switching required.
Slack & Microsoft Teams
Push alerts, daily summaries, and incident updates directly into your team's chat channels with rich formatting and actionable buttons.
PagerDuty, Opsgenie & Jira
Auto-create incidents, assign on-call responders, and sync resolution status back to Pulsely — all without manual handoffs.
Datadog, Grafana & Prometheus
Stream uptime data into your existing dashboards. Pulsely exposes metrics via Prometheus-compatible endpoints and Datadog integrations.
GitHub Actions & Webhooks
Trigger deployment checks, pause monitors during maintenance windows, and receive post-deploy health verification via webhooks.
What Engineers Say
"We replaced two separate tools with Pulsely. The 30-second check interval caught a DNS propagation failure in Frankfurt that our previous monitor missed entirely."
— Marcus Lin, Senior SRE at NexaPay
"The Terraform provider was a game-changer for us. We provision monitors for every staging and production endpoint automatically during our pipeline runs."
— Priya Sharma, DevOps Lead at Cloudform
"Our customers love the public status page. It reduced support tickets about 'is the site down?' by 73% in the first month."
— Daniel Okafor, CTO at Streamline Health
Frequently Asked Questions
How many monitors are included in the free plan?
The free plan includes 3 active monitors with 30-second checks, 1 status page, and email alerts. No credit card required — ever.
Can I monitor internal or private endpoints?
Yes. Pulsely supports agent-based monitoring for private networks. Install a lightweight agent on any server and monitor internal APIs, databases, or services.
What types of checks do you support?
HTTP/HTTPS, DNS, TCP, SSL certificate expiry, ICMP ping, and keyword/content verification. Multi-step transaction checks are available on Pro plans.
Is there an SLA for enterprise customers?
Enterprise plans include a 99.95% uptime SLA for our monitoring infrastructure, dedicated support, SSO/SAML, and custom escalation policies.
Start Monitoring in Under 60 Seconds
Add your first URL, pick your alert channels, and let Pulsely watch your infrastructure 24/7. Free plans never expire.